Statistical quality control in production processes
Using advanced statistical models, we can identify, correct and / or improve those factors that influence our productivity, increase quality, and apply continuous improvement of processes.
We start this article asking the simplest (not because of its response but formulation) and with more probabilities that the readers have faced along their lives: What is quality?
Depending on the type of business, its definition will have a different focus. In production, we could define quality as the degree to which a product conforms to the desired specifications on its characteristics and in a way that meets customer expectations. Therefore, quality is somewhat subjective, which is why companies usually assume that, as they do not have control of all the variables that influence production, process management is not worth. But it is the opposite.
Should we leave to chance what is within our reach to correct and improve? There are multiple factors that intervene in production process and that we can observe and supervise to achieve continuous improvement: from machines used to staff efficiency, for example.
However, we should bear in mind that quality management does not refer only to quality assurance, but also to guarantee the consistency of all final products with each other. This means, all of them meet the same requirements to the same extent.
To measure quality, it is a must to implement controls. Quality control is the process that ensures standardization, reliability and manufacturability of a product or service. Thus, there are specialized statistical tools and methods for the inspection, identification, and control of processes. Using them, we can have more information and a deeper understanding so we can make decisions that will increase quality and, therefore, productivity and profitability.
In brief, we could say that the main advantages of quality control are the reduction in the number of:
- Inspections and supervisions
- Delays
- Nonconforming units (that must be discarded and / or reprocessed)
- Waste
And a better use of:
- Human resources
- Machines
- Materials
- And so on
But, as we mentioned at the beginning of the article, these advantages vary depending on the business model.
Variability, a difficulty we should not be afraid of
Face intrinsic variability is a major challenge. Variability is a magnitude that represents the degree of variation in a set of values or scores (the range between the minimum and the maximum value observed) and an indicator of the capability that a process has to meet the required quality. There are two types of variability:
Variation itself is neither good nor bad. It is something natural of life. The aim of Statistical Process Control is to maintain the process under control and rapidly detect the occurrence of special causes (and their origin)
There are certain situations in which variability cannot be reduced (or that it will be better to increase it to improve process efficiency). For example, when we reduce costs and increase variability, but we are not breaching the specifications. What we should define very clearly is to what extent we will be willing to sacrifice some values for others.
There have emerged numerous strategies for quality increase, such as the Six Sigma
Six Sigma is a strategy focused on productivity increase through the reduction of the variability. Businesses that implement them in their operation system seek optimization along all the phases in the processes and apply continuous improvement of them. Thus, they can reduce the number of defects in the final products and services and make these changes sustainable over time.
Six sigma means “six standard deviations from the mean” and the objective is to obtain a maximum of 3,4 Defects Per Million of Opportunities (DPMO), considering “defect” as any event in which a product does not meet the requirements. In a Six Sigma state, all results are in the desired level and variation is very low
One of the key techniques to carry out this methodology is Statistical Process Control, SPC, a set of tools and techniques to monitor the performance of a process in order to:
- Study, evaluate and systematically reduce process variability.
- Identify special causes of variability and eliminate them.
- Have a deeper knowledge and understanding of a process.
- Increase process effectiveness and efficiency and achieve continuous improvement.
Image: Simbol used to represent Six Sigma
Control charts
Statistical Process Control relies on control charts, which have two dimensions: the vertical axis represents the value of the variable of interest. On that axis, there are three lines:
- The Central Line (CL), a measure of data centralization that matches the mean value of the quality characteristic studied.
- Two lines that represent the Upper Control Limit (UCL) and the Lower Control Limit (LCL), which are generally within ± 3 standard deviations from the central line (hence the relation between SPC and Six Sigma).
The limits are obtained from a statistical analysis of the data and represent the range within which most of the points should fall if the process is under control. The variability we get on it is caused by common caused and calculated basing on measurements of it. There should include a 99% of the observed data.
A process is under control when the observed quality varies in a stable manner around a value and this variation is due to random.
Image: Representation of a control chart

The values that are out of the interval of the control limits and mean that we have a special variation we must eliminate
With SPC we are continually contrasting hypotheses to verify if the process is under control, so we have to periodically collect samples to perform the analysis.
If the hypotheses is true, the mean and standard deviation (statistical measure that represents variation) of the sample will be within the natural limits. Still, there are other situations where all values are between the limits being the process under control:
- Seven points in a row on the same side of the center line (above or below).
- Seven points in a row growing or decreasing.
- Fourteen points in a row alternating up and down.
- Any other unusual pattern.
It is important to understand that the difference between a process control and a process specification.
A process can be not controlled but meet the requirements, and vice versa. Thus, with the control limits we evaluate if a process is under control and with the specification ones if the products meet the requirements.
SPC allows us to anticipate future problems that make the process stop being under control and correct inconvenient on time (it means, before the client receives the products). The comparison of the control limits of the process and specification limits will analyze the process capability.
How do we create a control chart?
- We select the variable or attribute we want to measure, define the size of the sample and the frequency of the data collection.
- We set the limits with the process under control.
- In this stage, we obtain homogeneous samples.
- Calculation of the statistical values that we need to complete the graph: the mean and standard deviations (control limits)
- We represent the data, analyze it, and obtain graph
- Identification of situations out of control
- We act and eliminate special causes of variation
Types of control charts
- X, R and S chart to measure a quality characteristic within one subgroup in a continuous variable.
- C-chart: Monitor the total number of nonconformances or defects within one subgroup (in a series of X samples of the same size).
- U-chart: We use with the same objective as c-chart. But U-chart is used when the number or size of inspection units for which nonconformities are to be counted may vary.
- NP-chart: Number nonconforming within one subgroup with a constant size.
- P-chart: Fraction nonconforming within one subgroup (those that do not meet specifications
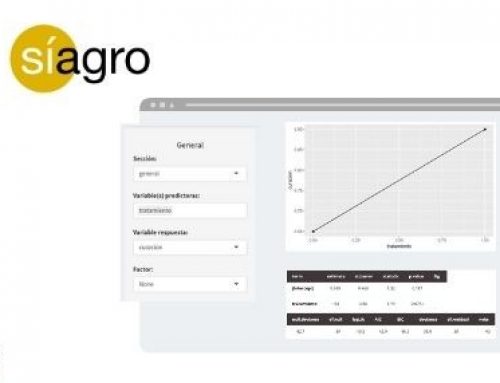
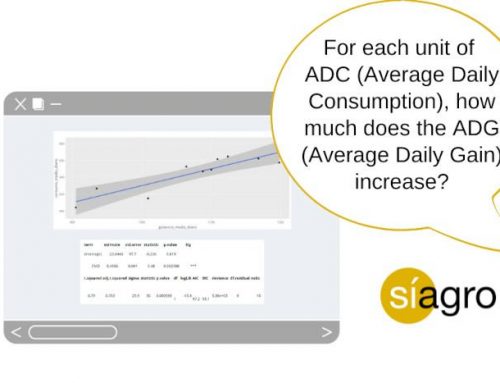
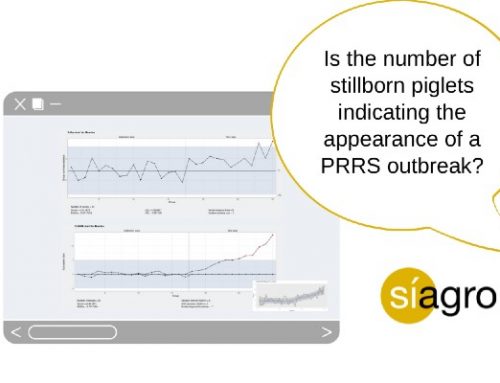
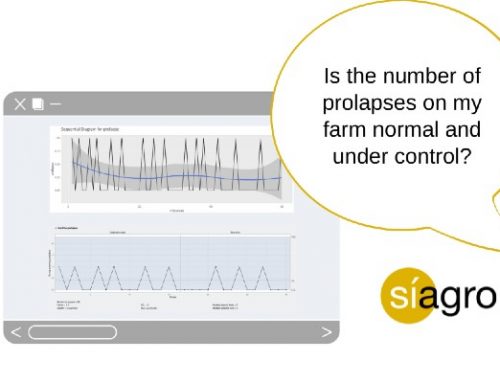
Síagro, a Web Application with an user-friendly interface that will allow you perform SPC easily and apply continuous improvement of processes
Do you know R, programming language? With R, we can obtain control charts through “packs” (by using programming code). The possibility to design Shiny Apps is another functionality it includes. In these Apps, users can rapidly obtain from a unique control panel all those analysis that have been enabled.
In these four lines, we have summarized what Síagro is. Síagro is a Web Application developed by Tests & Trials that includes all statistical models needed for process control and quality increase that allows to analyze any production data instantly. It includes specific and advanced models for data analysis and not only for SPC but also other methodologies that will complement and add value to it.
If we can correct errors before they occur, reduce variability, and apply continuous improvement of process, we will be much closer to excellence.
A very typical mistake when people do not understand variability causes, is to act arbitrarily on a part of the process, which sometimes leads to more variability.
Make data-driven decisions and increase your profitability and competitiveness with Síagro.
Ask us for more information or visit the website of the platform!