A/B Test: New analysis in Síagro
We started march expanding functionalities and improving the Síagro software with the incorporation of a new analysis: The A/B Test.
Customers and users who enjoy a free trial (which you can request for free by filling out this form) can now perform one of the most widely used analyzes not only in the marketing industry but also in trials in various industries.
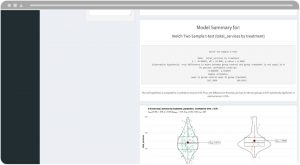
The A/B Tests compare the performance of two tests on the final variable
Analysis scalable to multiple industries and projects, the Síagro interface allows you to perform:
- Parametric and non-parametric hypothesis tests to compare two groups.
- qq graphics for groups.
- Normality tests and adjustment of the desired confidence level.
In addition, Síagro manages to detect large deviations from normality, and for such cases, it automatically suggests non-parametric tests to the user.
Used by professionals who are not experts in Statistics to make decisions based on data, Síagro is potent, interactive and fast.
The main advantage that this analysis offers for users is the determination of which version is better or worse for our final variable (and if it is significant). For example, if we have two groups (control and treatment), we can check the increase or decrease in the Feed Conversion Rate depending on whether we use our usual feed or a new one.
Measuring the impact of each modification on the final conversions (for example an increase of X% in the average daily gain or a reduction of X% in piglet mortality) allows companies to optimize resources and make decisions focused on continuous improvement. These could be from the purchase of the material that provides the best results, the most efficient protocol, the supplier with the highest quality products…
What are the steps to carry out an A/B test?
We invite all readers to consult more information on the official website of the Software where they will find additional information on the rest of the statistical offers, or to contact our team directly to book a free demo.