Is the number of prolapses on my farm normal and under control?
The control chart C is used to control the total number of events in a given process in continuous support, that is, errors per unit, that follow a Poisson distribution theoretically with infinite possible values. That is, there is no group size to calculate proportions.
The inspection unit must always have an equal probability of occurrence of the defect. The most common use is to monitor the total number of nonconformities measured in a series of k samples of the same size.
It is based on the number of defects per item for samples of equal size. A defective unit may have one or more defects and still not be defective because of the significance of the defect.
Some examples of when we use a C chart:
In this case, we are going to see how we study data of rare, exceptional, or strange events (in pork production) due to their low frequency of occurrence. What we are going to check is whether these events that occur with low frequency are significant or not and if we must do something when they appear again.
Rectal prolapses occasionally occur on sow farms, which should be noted and analyzed with caution as it can be a special symptom
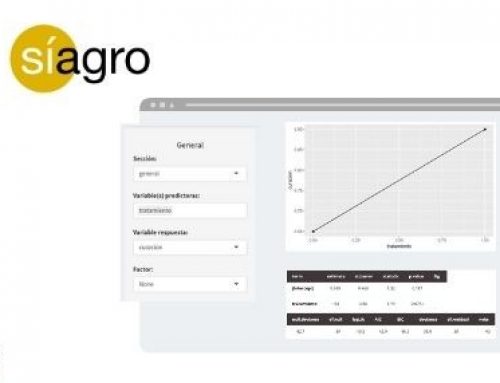
Para resolver este ejercicio, nosotros hemos utilizado el programa Síagro y cargado un archivo de datos (ficticio, por razones de confidencialidad) con la siguiente información.
Let’s imagine that in June 2019 there was a uterine prolapse of a sow after farrowing and our management program informs us that this is the first prolapse of this year and that the average for the last four years is 0.29 monthly prolapses. Is the appearance of this event important or not? If we want to see it graphically, we can generate a time series chart.
To solve this exercise, we have used the Síagro program and loaded a data file (fictitious, for confidentiality reasons) with the following information.
| date | prolapse |
| 01/08 | 1 |
| 02/08 | 0 |
| 03/08 | 1 |
| 04/08 | 0 |
| 05/08 | 0 |
| . | . |
| . | . |
| . | . |
| 10/12 | 0 |
| 11/12 | 0 |
| 12/12 | 1 |
Prior to starting the analysis, we are going to explain the database. As we can see, the variables are counts and, moreover, they are counts of exceptional or occasional events that are normally independent of each other. The opportunity area of the event is the same among the time periods. Therefore, we will make a C chart.
This file contains data on the appearance of uterine prolapses from a sow farm taken monthly for 60 months. It has three variables:
- Date: start date of each month.
- Prolapse: total number of prolapses that occurred during that month.
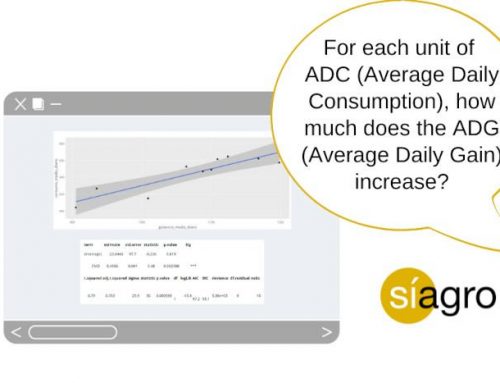
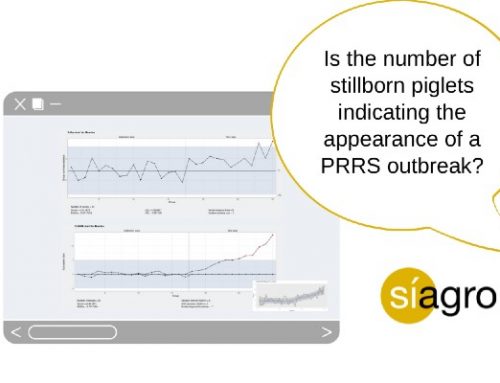
If we access to EDA / Sequential in Síagro and select the variable “prolapse” from the database, we will obtain the following graph:

If we access SPC Analysis and select the study variable, the option of a C chart will automatically appear:

The graph informs us that the average appearance of prolapses in this time studied is 0.4 prolapses per month (center) and that the upper control limit is 2.29 prolapses per month (UCL), so, now, we can make the decision not to carry out any update. The calculation of the upper control limit is carried out automatically by Síagro following the statistical formula.
Alternative: There is another way to control the appearance of exceptional events. Following the example: prolapses in a sow farm.
Instead of controlling the events, we can control the number or frequency of events that appear per year (in case to follow that rate of appearance), and then we can use either the X control charts or the “p” charts.
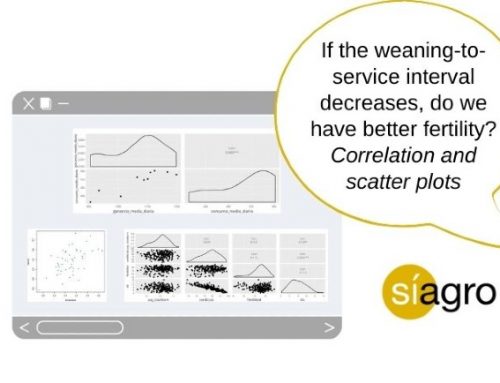
To do this, we will use a database that contains two additional variables: “diaentre” and “prolaano”. “Prolaan” is the theoretical annual frequency of the appearance of prolapses and that we will represent with a control chart of individual values:

The graph informs us that the average occurrence of prolapses in this farm during these 5 years is 5.26 (center) prolapses per year and that our attention limit is 7.16 prolapses per year (UCL).
Go to Síagro to know more about this statistical program!