When can we make a P chart, but not a NP chart, if what changes is the scale?
There are several types of attribute control charts when the variables are categorical. Two of them are the P and NP charts. The first are used to control proportions, and the second, to control counts, within groups of a certain size, for example, batches, orders in a day, etc.
The form of the P and NP graphs is the same, what changes is the scale: proportions and natural numbers, respectively.
But many times, we can make an P graph but not an NP. Here, we are going to explain very briefly and with a practical case when this happens.
Let’s suppose that we have data from 24 product samples produced per shift in a slaughterhouse. In this case, we have the following database:
| sample | production | n_defectives | n_defects | p |
| 1 | 96 | 8 | 1 | 0,08333333 |
| 2 | 96 | 12 | 4 | 0,125 |
| 3 | 95 | 17 | 2 | 0,17894737 |
| 4 | 99 | 16 | 4 | 0,16161616 |
| . | . | . | . | . |
| . | . | . | . | . |
| 28 | 101 | 13 | 2 | 0,12871287 |
| 29 | 102 | 12 | 2 | 0,11764706 |
- In the column “production” we have the total product manufactured per shift: number of package of lamb ribs.
- The column “n_defectives” indicates the number of defective items per shift (packages that do not meet the required quality standards)
- In the column “N_Defects” we have the number of defects found in the production of each shift (the weight of the tray lower than the established one, wrong labeling, incorrect placement of the pieces, …)
- The column “p” is the number of defective products between the production of that shift.
Note that for each shift the number of defects is equal to or greater than the number of defectives, since a defective item can have one or more defects.
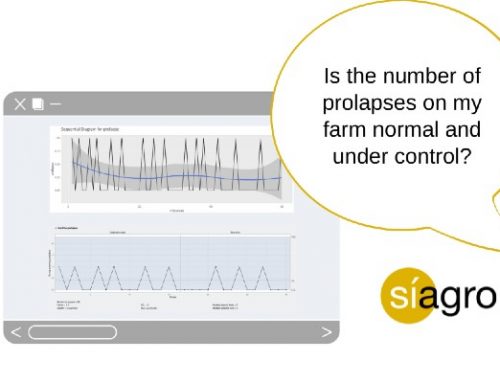
P chart with Síagro
If we extract a P chart from the Defective Products variable and group them by production (we have used the statistical program Síagro), we will obtain the following chart:

As in this case, the sample size is variable, the control limits also vary for each sample. Therefore, we cannot make an NP graph.
In conclusion, and as can be seen in the graph, there are four points that are out of bounds (samples 15, 16, 17, and 27). Now, we must investigate what happened in those periods to have points beyond the limits.
Control charts provide valuable information to detect changes over time. They are used in Statistical Process Control, a type of analysis used to control and improve quality since the last century. However, few programs include this type of analysis and, in addition, it is usually necessary to know how to program or have specific knowledge. This is why Síagro was developed.