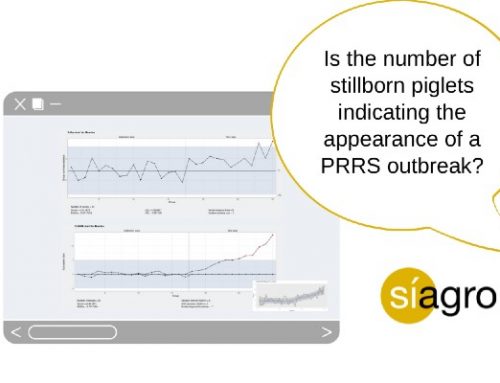
Does any vaccine produce a higher temperature increase than others after six hours of its application?
One of the most common statistical data analyzes is one that studies the effect that a factor (for example, a treatment) has on a continuous variable (for example, the weight of the piglets). To do this, we can perform a Student’s t-test or an Analysis of Variance (ANOVA).
While the first is only useful when the factor studied has two levels (for example, the treatment factor with the groups “with probiotics” in the feed and “without probiotics”), the ANOVA can be done when there are more than two levels (for example, to compare three types of probiotics).
The ANOVA makes it possible to relate an independent categorical variable with a dependent continuous quantitative variable through the comparison of “c” means.
The ANOVA explains the total variation and how it is distributed within the groups. Thus, it tells us if the variability of the groups is significantly different from each other.
In this case, we could answer the question: is part of the variability in weight among piglets explained by the fact that they are subjected to different probiotics? OR… does the treatment have any effect on the weight of the piglets? We can answer all this with an ANOVA, where we obtain a probability value (p-value) whose interpretation is very simple:
- p-value <0.005: There are significant differences among groups.
- p-value> 0.05: There are no significant differences among groups.
Therefore, when we compare our p.value (suppose it is 2 · 10-6) with a significance level that is 0.05 (5% error) we can accept the starting hypothesis. Following the example: a treatment affects the average profit of the piglets. On the other hand, if the value had been equal to or greater than 0.05 (5% error), we must accept the hypothesis that the treatment does not affect weight.
In this example that we present below, we are going to explain all the numbers that appear in an ANOVA, not just the p-value. We will perform the analysis with the Síagro program.
Suppose we have three vaccines for any given disease and that we record the difference in temperature between the time of application and six hours after application. The question we are going to answer is …
Does any of the three vaccines produce a higher temperature increase than others after six hours of its application?
Para responder esta pregunta hemos utilizado una base de datos que contiene información de dos variables: “Vacuna” (los tres tipos de vacuna) y “Temp” (el incremento de temperatura en ºC desde el momento de la aplicación de la vacuna hasta seis horas después).
- Variable categórica independiente: Vacuna.
- Variable cuantitativa continua dependiente: Temp.
- Comparación de las medias de las tres vacunas: V1, V2 y V3.
To answer this question, we have used a database that contains information of two variables: “Vaccine” (the three types of vaccine) and “Temp” (the increase in temperature in ºC from the moment of application of the vaccine up to six hours after).
- Independent categorical variable: Vaccine.
- Continuous dependent quantitative variable: Temp.
- Comparison of the means of the three vaccines: V1, V2 and V3.
| id | vaccine | temp |
| 1 | V1 | 1,48 |
| 2 | V1 | 0,22 |
| 3 | V1 | 1,32 |
| 4 | V1 | 0,96 |
| 5 | V1 | 1,1 |
| 6 | V2 | 0,5 |
| 7 | V2 | 1,6 |
| 8 | V2 | 0,24 |
| 9 | V2 | 1,56 |
| 10 | V2 | 0,56 |
| 11 | V3 | 1,46 |
| 12 | V3 | 0,46 |
| 13 | V3 | 0,76 |
| 14 | V3 | 0,8 |
| 15 | V3 | 1,16 |
As always, we must rely on the null hypothesis (Ho) that we want to verify. For this example, “there are no differences between the temperature increases between the vaccines”.
But you don’t “put the cart before the horse”. Prior to an ANOVA analysis, we must explore our data:
- Look for anomalies or strange values,
- check the normality of the response variable within each group (of each vaccine),
- and check the homogeneity of the variances (homoscedasticity) and that the values are independent.
This is because the ANOVA calculations are based on the fulfillment of these three premises and, if we perform this analysis when these are not true, it is very likely that we will draw wrong conclusions.
Fortunately, the statistical program Síagro makes all these calculations automatically. We just need to go to Prediction Models / ANOVA in the dashboard and select our variables. Results:

- df: degrees of freedom.
- Sumsq: sum of squares
- Means: Average of squares
- Statistic: Contrast statistic F
- P-value: Probability


We can also check these assumptions within the Síagro Exploratory Analysis if we feel more comfortable:
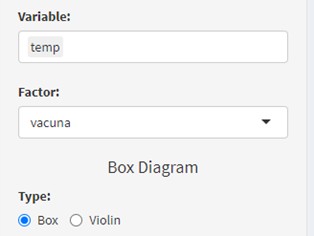
First, we extract a boxplot of the temperatures by groups and select both variables in the control panel. We will obtain the same box plot where we see that there is no anomalous data (outlier) and that the increase in temperature seems (at first glance) different between the vaccines, and the summary of the data:
Summary for weight
| Min | Mean | Median | Max | Variance |
|---|---|---|---|---|
| 0,22 | 0,945 | 0,96 | 1,6 | 0,231 |
Summary for vaccine
| vacuna | Min | Mean | Median | Max | Variance |
|---|---|---|---|---|---|
| V1 | 0,22 | 1,02 | 1,1 | 1,48 | 0,238 |
| V2 | 0,24 | 0,892 | 0,56 | 1,6 | 0,409 |
| V3 | 0,46 | 0,928 | 0,8 | 1,46 | 0,15 |
Secondly, to check normality, we can use all the data without differentiating by vaccines. However, it is better to do it by separating by groups, something that Síagro allows us to do in the Normality Test.
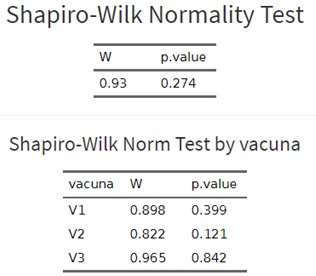
It is observed that neither as a whole nor in any of the three groups per individual normality is violated (p-value is greater than 0.05).
The third premise (the verification of the homogeneity of variances) can only be done within the ANOVA analysis (already seen above).
In the Exploratory / Balance Analysis we will also have obtained the following data (means and standard deviations of each group) that help us to understand how variability behaves in terms of standard deviation within each group:
| V1 (N=5)
Mean |
V1 (N=5)
Std.Dev |
V2 (N=5)
Mean |
V2 (N=5)
Std. Dev. |
V3 (N=5)
Mean |
V3 (N=5)
Std. Dev. |
|
|---|---|---|---|---|---|---|
| temp | 1,0 | 0,5 | 0,9 | 0,6 | 0,9 | 0,4 |
Final interpretation of the ANOVA: As our p-value is 0.927 (greater than 0.05) we can say with evidence that there are no statistically significant differences between the three groups and the vaccine has not affected the temperature of the piglets six hours after its application.
Síagro includes many more statistical models to analyze data
This is just one example of everything that the program is capable of analyzing, so we invite all readers to visit the official website and discover the world of Síagro.