Why is the analysis of the data important to increase the production performance level?
Many businesses require evidence to believe in data as fundamental to make decisions based on evidence (Ironic, isn’t it?). It is still a challenge in this industry to educate professionals that analyzing data is key to increasing competitiveness and conquering the market. There are many companies that do not rely on Statistics to help in the decision-making. They go “fishing”, let’s see what happens.
A worker may have planned the same duties for two different days, and still, face very different scenarios. This is what variability is about, with an inherent part and another that statistically can be controlled and reduced. Being prepared to act no matter which circumstance occurs is vital, and although we may be lucky if we base on impressions or feelings… this does not occur on successive occasions.
If we are following a work methodology in which data is not recorded correctly, or with a lack of guidelines or systematization, its posterior analysis is impossible:
- We will find irrelevant data because does not record enough information, or because
- The data is messy (also, it Will be difficult to know its origin to rewrite properly).
The root of this problem is on the company culture and organization. Educating professionals should be seen as an investment, and not as an expense. Improve today to see results tomorrow.
The value of the data for the decision-making process is incalculable
In the words of Lord Kelvin, a physicist and mathematician of the last century,
“What is not defined cannot be measured. What is not measured, cannot be improved. What is not improved, is always degraded. ”
Measurement is part of the management, and not something optional.
Establishing control and performance indicators, and analyzing their impact, help us to know our strengths and weaknesses. If we define the factors that influence production and quantify and prioritize them according to a context, we can act efficiently and proactively. Why? Because we would have done an analysis with which we would have found the origin of each deviation.
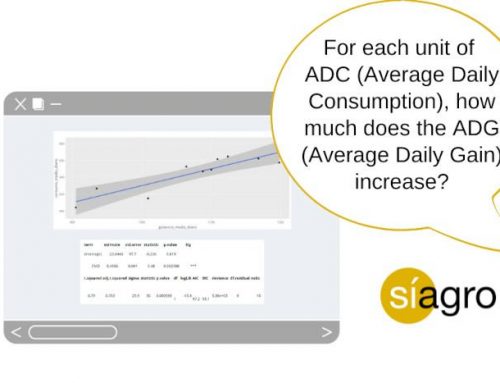
Researching and getting useful information, we can answer daily questions about our process performance
Let’s suppose we want to control a process in which the variable of interest is the number of weaned piglets (NWP). Our objective is to test if it is under control, which means, that any variation (an increase and decrease of the NWP) in this data and over time, is due to natural variation (that we cannot control and may be generated by natural variations in the temperature or humidity of a farm, for example).
Now that we have a context and verified that during the last 12 months the NWP has maintained a normal variation, suppose that we have applied a change: introduced a new vaccination protocol.
Many professionals would wait to “see” if this change is generating higher productive returns, and draw conclusions based on impressions. The bias they are facing is such that they could make two types of errors, which statistically have a certain term:
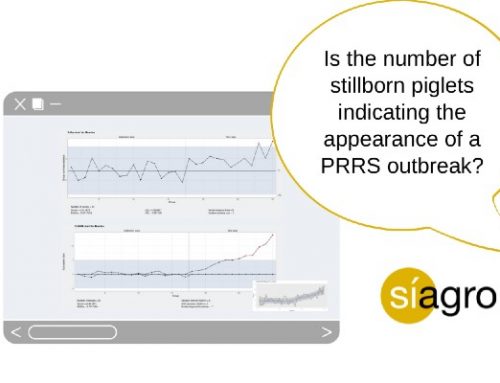
But the system to follow should be different, more exact, and even simple (once implemented): Define objectives, record data, store them and perform a Statistical Process Control (SPC) analysis:


Image: Control Charts of an SPC analysis.
These graphs are very visual and easy to interpret. The vertical line represents the moment where we have (in our example) changed the vaccination protocol.
“These charts do not say that something is wrong, but that something has changed and the process is no longer under control.”
As we are analyzing the NWP, what we are interested in is that production “goes up” and the dotted line moves to the top. Thus, the conclusion that we can draw based on evidence is that the change is working and good for the conditions of the farm analyzed. Thus, applying it for a longer time and under a controlled system, the company’s income can increase significantly.
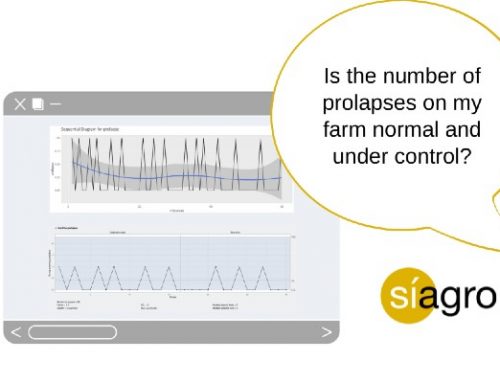
We propose other examples where an SPC would provide very useful information:
- Know the percentage of repeated sows during a period of time, investigating in detail possible increases associated with a certain failure. In such a way, if the time frame is large, we will have saved time and money in analyzing each month or week individually, since our critical moment is clear.
- Detect a greater or lesser efficiency of the protocols and working teams.
- Evaluate the incidence of an illness and its evolution over time
Data allow us to see what would be impossible in other ways
Answering a “why” in time can solve many problems. Now that it’s autumn, the time of the year characterized by an increase in the number of abortions in pregnant sows, production companies face an increase in cases. These, although many occur due to natural causes that we cannot avoid, are also generated by other special or assignable causes that, although they are less, their influence is important and generates significant losses.
Having a deep knowledge of the process’s performance, factors and indicators of possible diseases, and an action plan, makes the difference.
In T&T, we have been more than 20 years working in the animal industry and understand the importance of analyzing the information in order to take action in time and avoid fatal errors.
Therefore, we have developed Síagro and is available for any business that:
- Wants to analyze its data and make decisions to increase competitiveness and profitability.
- Do not have enough resources or time to perform exhaustive statistical analysis or outsource to other companies.
- Want to educate their personal to update the working methodology to increase their productivity and engagement with the company.
- Bet for innovation and continuous improvement.
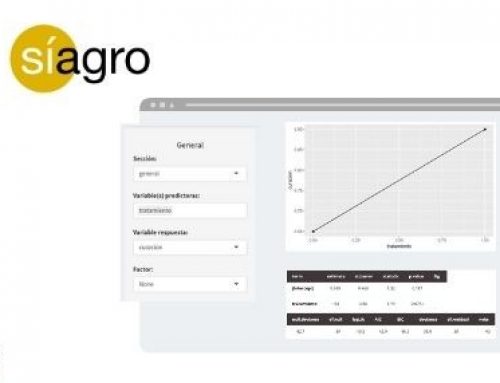
Síagro is a Web Application that allows, from a unique and intuitive dashboard, to run statistical analysis and create reports in real-time. No need to program or do mathematical calculations. Companies have absolute independence to analyze their data, without outsourcing this job to others that may not know some internal specifications (business objectives, limitations, or characteristics of the facilities, …).
You can consult the official website on www.siagro.es/en/home or write us at marketing@testsandtrials.com for more information.

Article published in Suis from Grupo Asis.