Statistical Process Control for quality management
Making changes? Want to evidence their impact and measure improvement? Then think about using Statistical Process Control, SPC.
Checking your process performance? Want to control your processes and apply measures? Think about SPC too.
Process management is one of the quality requirements stablished in the ISO 9000 Standard. Through the control of the processes, we manage to satisfy the requirements of the products. By the process continuous improvement, we can improve the effectiveness and efficiency of our activity and reduce variability.
Companies that implement it as part of their strategy use different tools and techniques to measure the degree of deviation in their production processes. One of them is the Statistical Process Control, SPC.
What is Statistical Process Control?
There are as many definitions as statisticians, but let us start with the following explanation:
‘’SPC is the use of statistical tools and techniques to measure a production process in order to detect change’’ [Webber and Wallace, 2011]
This definition is correct but incomplete. When we use this technique, we have customized measurements of the processes and we focus on reducing variability, increasing the final quality of the products and reducing waste.
Statistical process control (SPC) is a philosophy, a strategy, and a set of methods for ongoing improvement of systems, processes, and outcomes. It is mainly based on learning through data to reduce problems and analyze the impact of our changes.
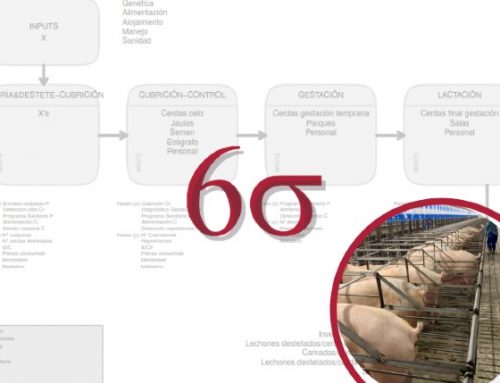
This process measurement is a set of variables that are identified through process maps (among other methods). Usually, only a small number of these variables are of interest. These ”variables of interest ” are what are commonly called Critical To Quality (CTQ) and whose performance standards must always be met.
Variability, how does it impact our process and why is it important to reduce?
When we talk about reducing variability to increase quality, we do not mean to eliminate. This is impossible as there is always deviation due to natural causes. In any process.
In the agri-food sector, the systematization of quality control cannot be as deeply rooted as in other industries, for reasons due to the intrinsic variability of the factors: each apple is different, each animal has its own characteristics and responses to a , …
What we can do (and here is the reason to stablish a quality statistical control) is to control the assignable causes of variability that are detectable and under our control to eliminate. In fact, many times we are not aware of the improvement we can achieve by having information even if our processes are under control.
Variation itself is neither good nor bad. It is something natural of life. The aim of the Statistical Process Control is to keep the process under control. That is, keeping the variation within the natural limits.
Detect those special causes of variation help us to identify when something is out of normal and react on time. Observing the exact moment of the process where the negative change started, we can rapidly solve it and avoid waste.
But this also tells us when not to act. It may be that you have detected a rare or special trend in your production process, and you suppose the reason. Using statistics we can detect whether our predictions are true or not. So what is worse? Not detecting a problem in time or believing that there is one and implementing errors to processes that are under control and working perfectly?
Control charts
Have you ever heard of the control charts?
Control charts are two-dimensional charts, where the vertical axis represents the value of the variable of interest. On this axis, there are three lines, the center line (CL) and the upper limits (UCL, upper control limit) and lower (CLC, lower control limit).
The center line represents some measure of centralization of the data, for example the mean. The upper and lower limits represent some measure of dispersion of the data, such as the distance between the mean and three standard deviations.
What we do by controlling the processes by means of control charts is a continuous hypothesis test to check if the process is under control.
When is a process under control? It is when the observed variation is natural and attributed to random, both the mean and the standard deviation of the sample being within the natural limits.
Example of a CUSUM control chart:

In the end, what we have to stick with are two main ideas: We need to know, understand, and interpret our data correctly to make decisions, correct errors and increase our productivity and profitability.
A last thought:
What is not defined cannot be measured. What is not measured cannot improve. What is not improved, is always degraded. Lod Kelvin
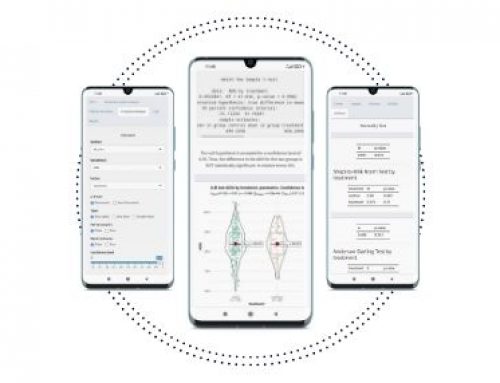
At Tests&Trials, we lead this type of projects to help our customers to continuously improve in their processes and never be a step back. But, if you prefer to maintain things internally, our statistical application Síagro is developed in a way that to can easily and in real time carry out this statistical analysis. You only need to contact us and get your password to start improving.